8.3 EMP_enrich_dotplot
The module EMP_enrich_dotplot is designed for the enrichment result.
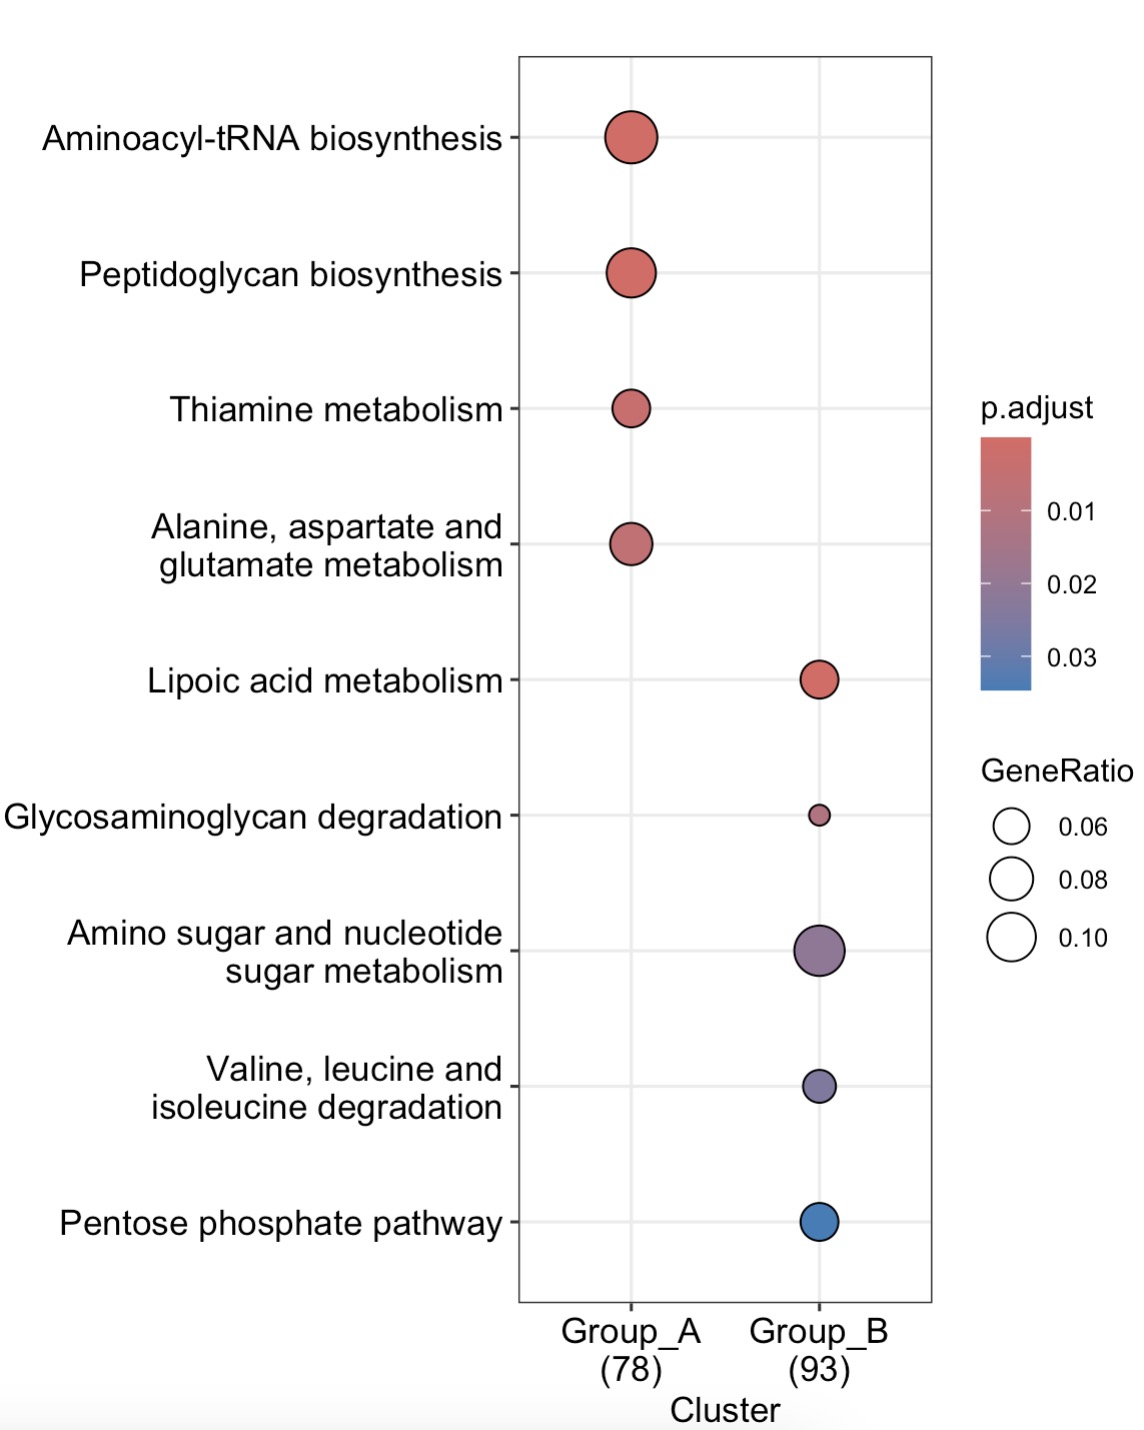
8.3.1 Dotplot of KEGG enrichment result
The module EMP_enrich_dotplot inherits the dotplot from the enrichplot package, which can visualize the results of enrichment analysis.
🏷️Example:
MAE |>
  EMP_assay_extract(experiment = 'geno_ec') |>
  EMP_diff_analysis(method='DESeq2',.formula = ~Group) |>
  EMP_enrich_analysis(condition = pvalue<0.05,keyType ='ec',KEGG_Type = 'KEGG',
                      pvalueCutoff=0.05,species = 'all',combineGroup = FALSE) |>
  EMP_enrich_dotplot()